In linux, there is a command that allows you to take a picture and look at how the resources in your system are getting used (or wasted) and I want to give you a quick explanation on how you can monitor processes that are running on your machine.
A command to rule them all – top
The answer is very easy, there is a simple linux command that allows you to monitor exactly what processes are running on your machine at the moment you type it, along with memory usage, CPU consumption and details about swap memory used. And yes, it is accessable from your favourite shell (Hi linux shell, nice to meet you!)
The command is top (link to its ‘man’) and it allows you to see what is going on at that moment in your machine, and more generally your system status:
The output is similar to the one you can find in the next image:

Well but.. what does that mean?
Output can be confusing at the beginning, but here are the details about it, for a better understanding about what’s going on!
System uptime and system average load
The first line shows the uptime of the system, that is to say how many hours or days your system is up and running
In my case, the detail of the first line is:
- 16:44:12 the current time
- 2 days, 6:13 is the current uptime
- 1 user means that 1 user is currently using the system
The next 3 values show the average load for the last minute/5 minutes/15 minutes: 0,65, 0,57, 0,45
Monitor the task status
The second line provides information about the status of the tasks actually loaded in your system
Basically the word near the number is the current status of the task.
Geek CPU stats
The third line represents a brief overview of the state of the CPUs in your system.
Each parameter represents a different indicator about CPUs status, shortly, this is their meaning:
- us – User CPU time – How much time CPU has been spending the processes ran by users
- sy – System CPU time – Similar to us, but it defines the time spent running the linux kernel and related processes
- ni – nice CPU time – When prioritized with nice command, it indicates the time spent by CPU running those processes.
- wa – I/O wait – Represents the amount of time that CPU had to wait while I/O operations completed.
- hi – Hardware IRQ – It is the amount of time spent by CPU to serve hardware interrupts
- si – Software interrupts – Similar to hi, but it refers to software interrupts
- st – Steal Time – Since every modern CPU gives support to virtualization, this index refers to the amount of stolen CPU by the hypervisor, to execute tasks like running a virtual machine.
Memory usage, physical and swap
The following two lines give an overview of the memory status in your system, both for physical and swap memory.
Since modern system make a large use of caching, you will be more likely to see the physical RAM indicator almost full all the time.
On the contrary, swap space is a sort of ‘backup’ when physical memory can’t handle more stuff, so it is forced to write stuff on the disk to avoid losses. An high indicator of used swap space is a clear alert that something is not going as intended.
This is the line referring to physical memory:
While the next one gives information about swap memory:
So…where are my processes?
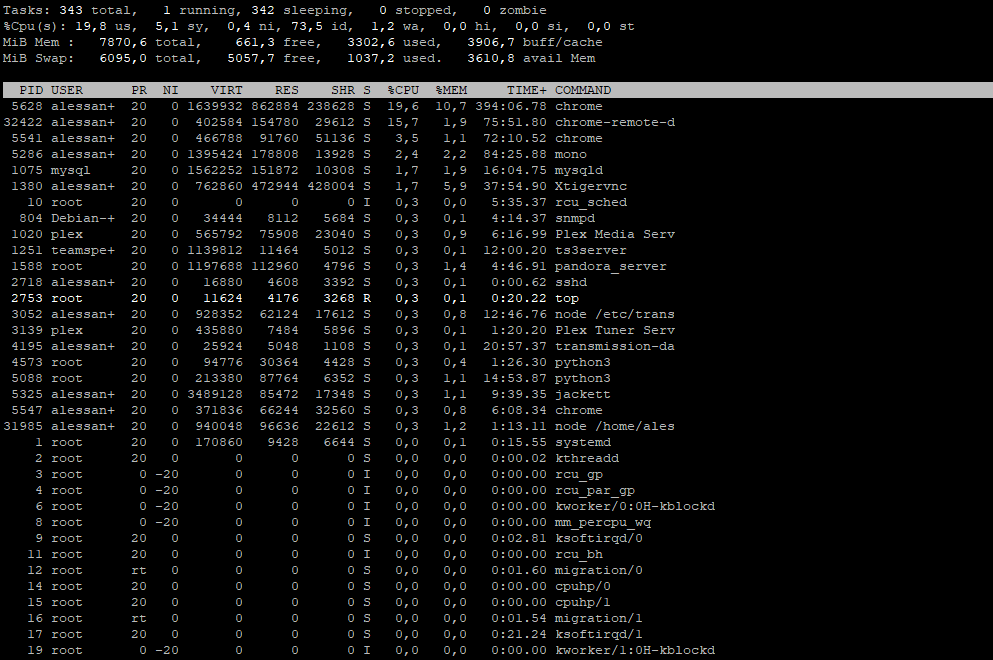
Here you go, the list beyond the previous lines represents the list of running processes, daemons, services running on your system and each line comes with varios deatils about the single process. Here is an extract of my list:
The indicators on the columns give various information about the processes running on your system, and I will try to explain them to you shortly.
- PID – It is the process ID
- USER – Indicates the user running the process
- PR – This indicator shows the process priority, if you see in the image “rt” means that the process has a RealTime priority, this is used for system processes.
- NI – Indicates whether or not the command nice has been used to enhance priority of the given process.
- VIRT – Refers to the amount of virtual memory used by a process, this means that it stores data, libraries and swapped pages in memory
- RES – How much of the process “RES”ides on the physical memory
- SHR – Indicates the size of memory segments that are shared for a process
- S – It is the current state of the process
- %CPU – The percentage of time that shared CPUs spend running a given process
- %MEM – Percentage of physical memory used by the process
- %TIME+ – Total time spent by CPUs running a given process
- COMMAND – The command used to initialize the process
What can I do with these precious information?
Well, this will help you troubleshooting various problems like memory/CPU % leaks, OOM errors, or just to know what are the running processes at that moment.
Of course, if you know the value in any of the columns, you can grep the value to focus the output on the given process.
Hope this article helped you understanding better what can you do with this command.
If you like it share it with your friends/colleagues!


Scrivi un commento
Devi accedere, per commentare.